Walk into Monday’s PLC with the data already on the wall.
Prism builds your common assessment in Google Sheets, grades it as students submit, and turns the results into a live data wall and intervention list for every teacher on the team.
Every school gets a 30-day free trial, shared by its teachers. School or organization Google accounts only.
Built by a 6th-grade math teacher. Runs inside the Google Workspace your district already has; student data never leaves it.
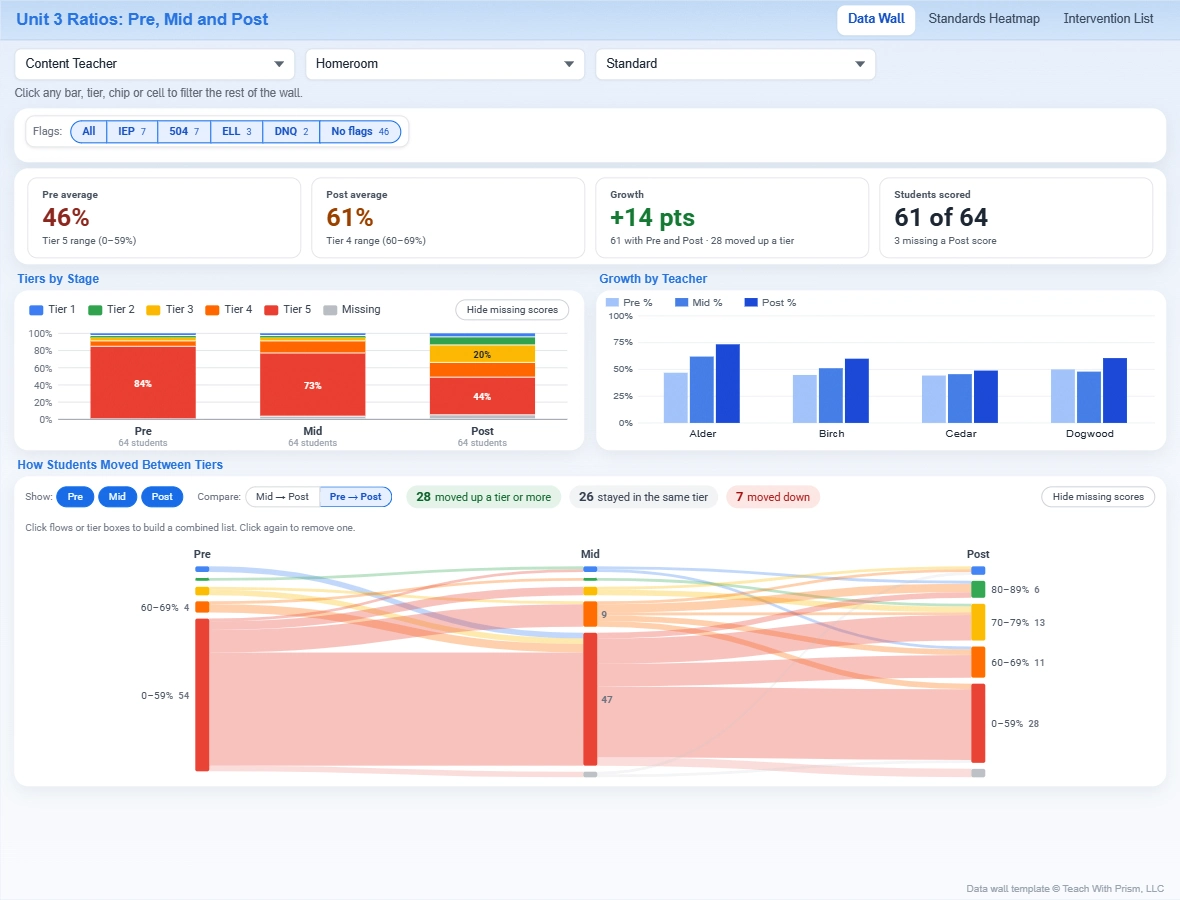
Click around a real wall.
The same charts Prism builds for your team, running on a made-up class of 64 students. Use the filters, click a tier or a wrong answer, and watch the rest of the wall follow.
Sample data only: the students, teachers and scores are invented. Prism makes a data wall and intervention list and fills in your assessment data automatically.
The night before, and the morning of.
Prism doesn’t add a step to your PLC. It does the chores so you can focus on your students' needs.
From test day to action plan in three clicks.
-
1
Create the assessment
Choose Launch Prism to build an assessment for your entire PLC.
StudentQ1Q2Q3Q4ScoreAdd-onsPrism›Launch PrismConnect to Data WallSettings -
2
Post to Google Classroom
Teachers post the master assessment link in Google Classroom.
New assignment: Post-test 2: RatiosPosted to all 6th grade math sectionsPost-test 2: RatiosGoogle FormsTurned in0of 142 -
3
Connect to Data Studio
With one click, the live dashboard opens so everyone sees responses visualized as they're submitted, with no data entry necessary.
Post-test 2: RatiosTier breakdown by teacherLiveResponses96Proficient56%
And the principal sees the whole year.
Each grade and content area names its big rocks, the few standards that matter most this year. The Year Overview shows every one on a single wall: where it stands, how far it has grown since the Pre, and which are still to come. Click a card for its growth charts.
Sample data only: an invented school, with made-up standards and scores.
See how many hours your team gets back.
Teachers spend about 4.5 hours per common assessment formatting spreadsheets, entering scores, working out tiers, merging data sources. Move the sliders below to match your team.
Estimate assumes 4.5 hours saved per teacher per assessment: building rubrics, combining scores and preparing PLC slides.
Priced for your PLC, school or district.
Every team is different, so every Prism quote is too. Tell us about your teachers and assessments, and we’ll put together a custom quote that fits.
Department or PLC
For grade-level and subject teams that compare results across teachers.
- Automatic team data syncing
- All Data Studio data wall templates
- Automatic MTSS and RTI tier groups
- Priority email and Google Meet support
School or district
District-wide rollout with roster sync and reporting for leadership.
- District-wide domain install
- Data Studio layouts in your district branding
- SIS integration (PowerSchool, Infinite Campus)
- Dedicated PLC coach and staff PD workshop
Questions teams ask.
Something else? Email us or search the help guide.
Your next PLC could start with the wall already up.
Book fifteen minutes. I'll build an assessment from your standards while you watch, and you'll see the wall fill in as the answers come in. Bring a department head if you can; they're the ones who stop asking "did everyone get theirs in?"